
Personal project · Python · 2021–2024
Formula 1 data analysis
Turning race telemetry into an explanation of where lap time is gained and lost.
I built Python tooling for telemetry and session analysis and published race-weekend reports. Here I revisit my article “How Ocon got out of Q1”, which I published on 23 March 2024.
The question
At the 2024 Australian Grand Prix, Ocon reached the second qualifying session while Gasly did not. I compared their laps to investigate where the difference emerged, using time-delta and corner-level telemetry charts.
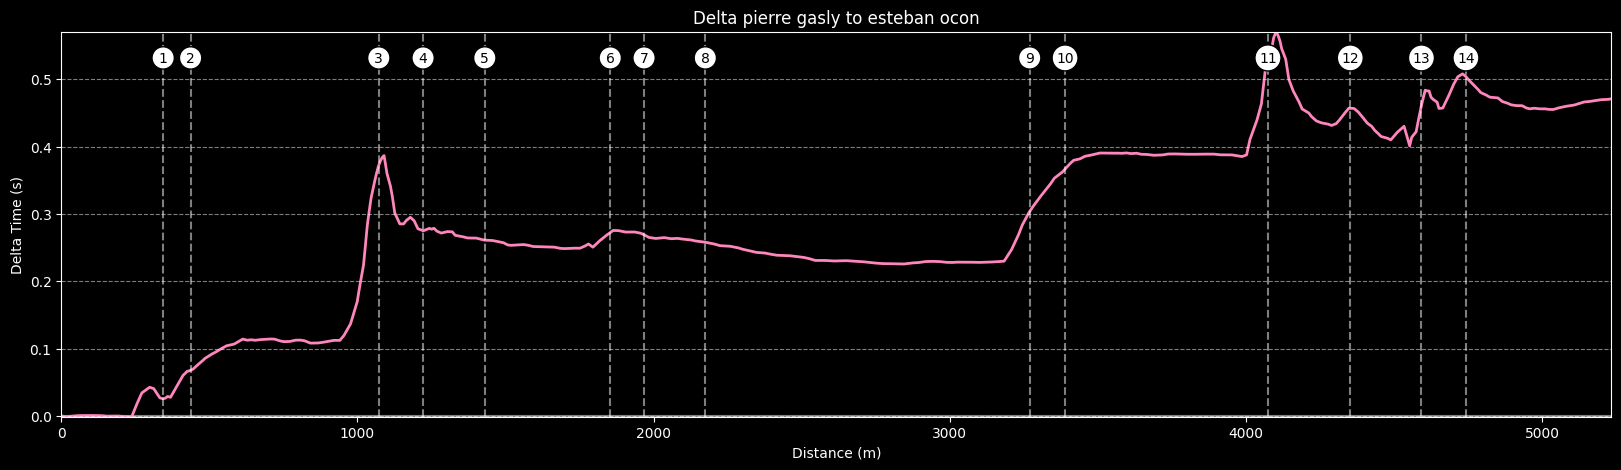
From lap time to driving behaviour
At turn three, I associated Ocon's later braking and greater corner-entry speed with a gain of about two tenths. I compared speed, throttle and brake traces to understand the drivers' approaches and what lay behind the final lap times.
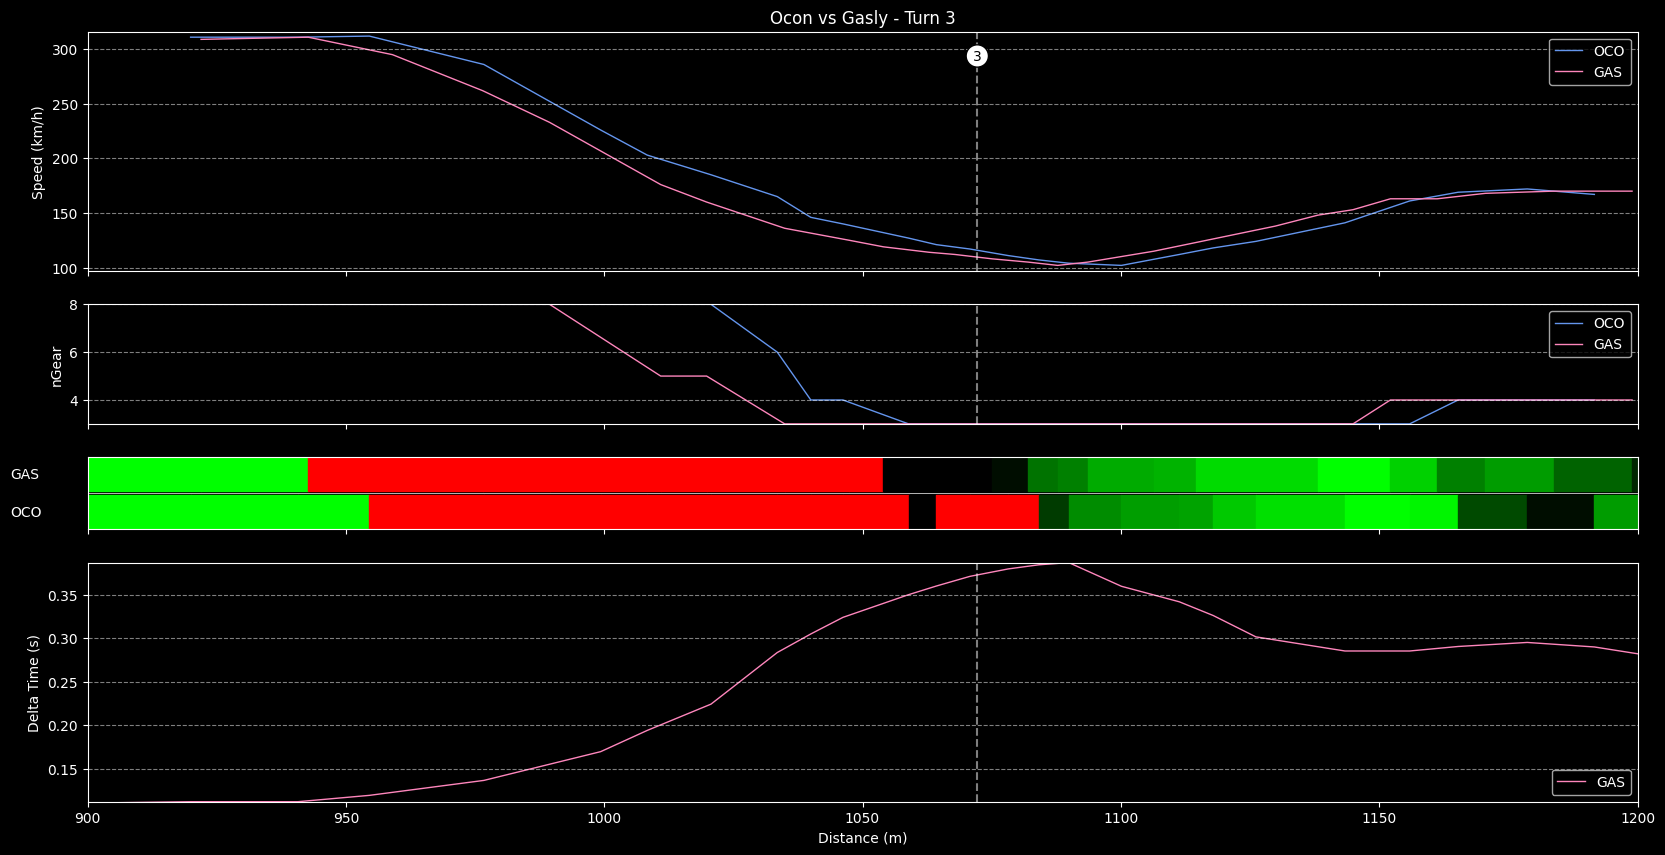
What I could not confirm
Public telemetry is incomplete. Brake-pedal pressure is unavailable, and recorded gear changes do not necessarily show attempted shifts. I could not establish the impact of Gasly's reported shifting problems from those traces. I could describe the recorded behaviour, but not recover every cause behind it.